Case study
Decision Tree Analyser
A Python CLI that explains dataset structure through entropy, information gain, gain ratio, and exported decision-tree visualisations.
Inside the project
Context
This university project turns the calculations behind decision-tree learning into a transparent command-line workflow. Instead of hiding the process inside a machine-learning library, it exposes the metrics that determine which attribute provides the best split.
Role
I implemented the data loader, statistical analysis, split evaluation, tree construction, console reports, and exports to text and Graphviz formats.
Constraints
The tool needed to work with simple text datasets, correctly handle attributes with different numbers of values, and present intermediate metrics clearly enough to verify the result by hand.
Approach
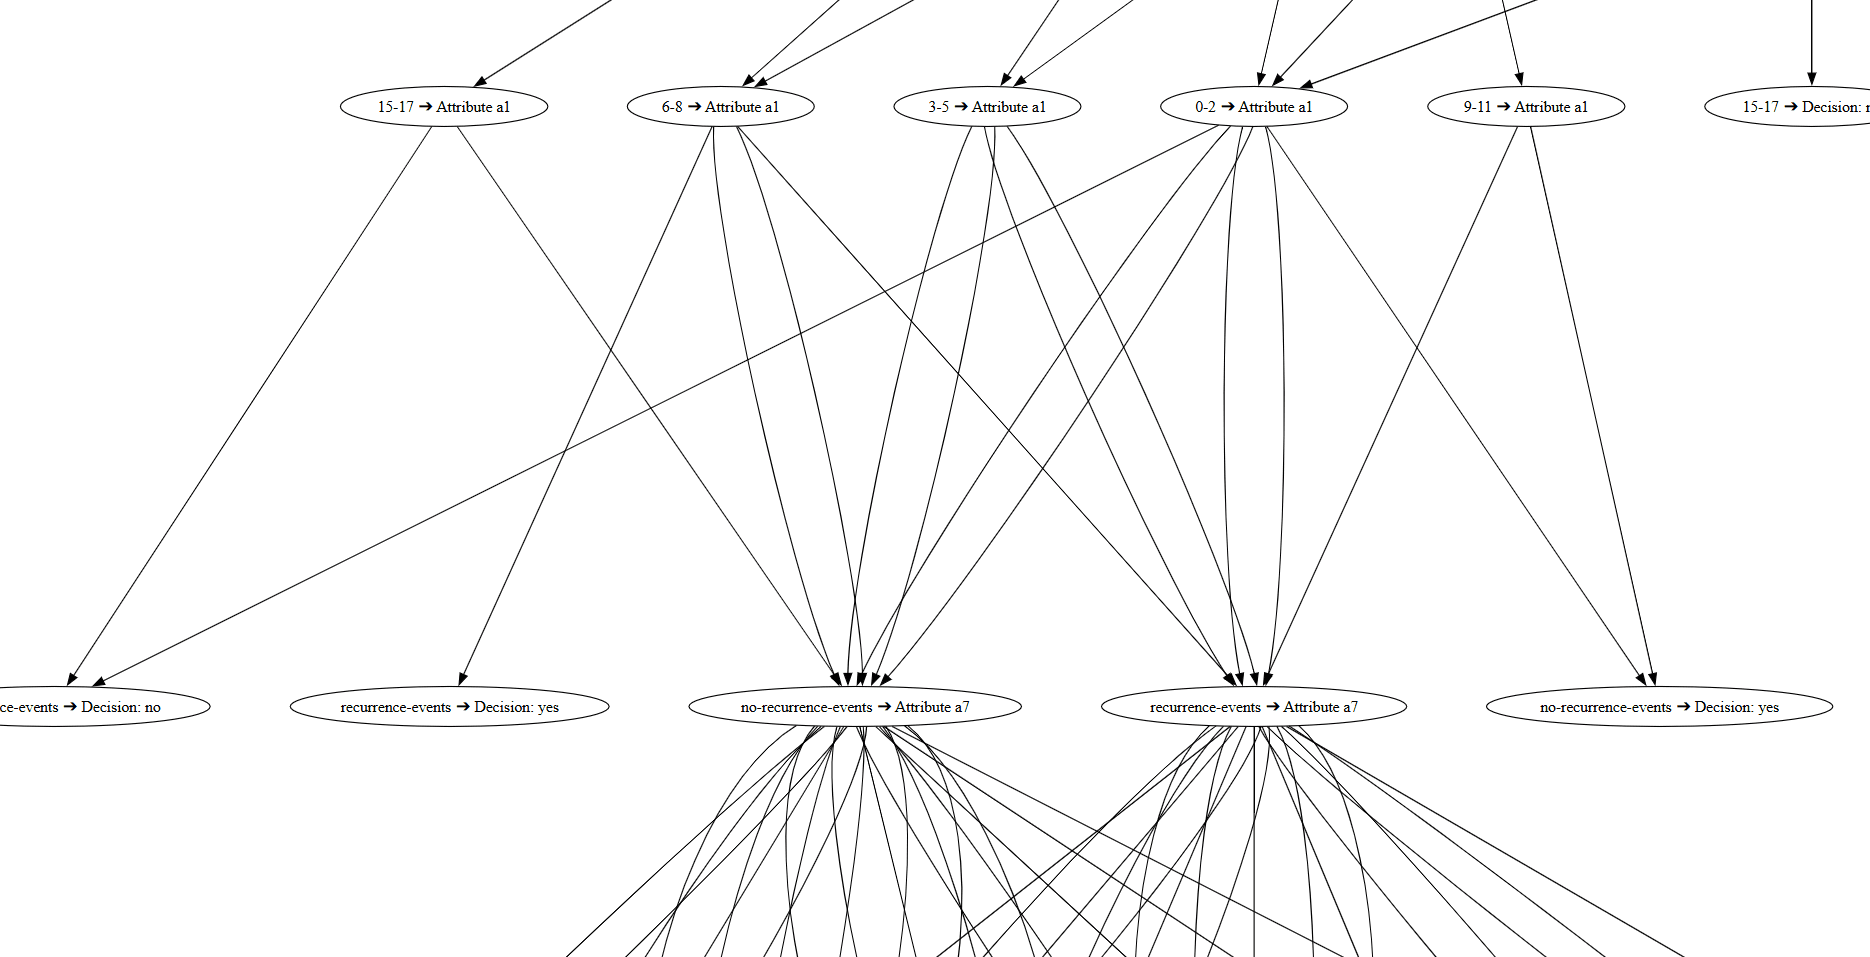
For every attribute, the program counts unique values and their occurrences, then calculates dataset entropy, conditional entropy, information gain, split information, and gain ratio. The attribute with the strongest ratio is selected for the next decision, and the resulting structure is exported as both readable text and DOT/SVG visualisations.
Outcome
The CLI produces a complete analytical report and a visual decision tree in one run. It is useful both as a classifier exercise and as an educational tool for understanding why a particular split is chosen.
Lessons
Implementing the metrics directly made the relationship between data distribution and tree structure much clearer. It also reinforced the importance of numerical edge cases, especially zero probabilities and attributes that carry little or misleading information.